Systems Architecture
vflow2 has five major systems beyond basic IFC analysis tools:
1. Connection Graph
Files: tools/_connection_graph.py + tools/connection_graph.py
- Assigns connection points (nodes) to all IFC elements (walls, doors, slabs, spaces)
- Creates edges between physically touching points using KDTree proximity (0.05m tolerance)
- Registry pattern:
@register_point_generator("IfcWall")— one function per element type - Door positions use
ifcopenshell.geom.create_shape()for actual mesh center (not placement origin) - T-junction detection for wall-wall meetings
- Cached as
<stem>.connection_graph.json
2. MEP Cable Routing
Files: tools/_mep_utils.py + tools/_spatial_graph.py + tools/mep_routing.py
- Auto-places lights (center-top of room) and switches (next to door, 1.05m height)
- Waypoint graph with ~15 nodes per room, axis-aligned edges only (no diagonals)
- A* pathfinding via networkx produces right-angle cable paths
- Routes returned as 3D point arrays for viewer rendering
See: 03_mep_routing.md
3. DIN 18015-3 Installation Zones
Files: tools/_wall_zones.py + tools/_ceiling_zones.py
- Computes installation zones per German electrical norms on wall and ceiling surfaces
- Wall zones: horizontal/vertical corridors, T-junction splitting, exterior face detection
- Ceiling zones: per-IfcSpace (one slab spans multiple rooms, walls divide below)
- Solid ceiling: ZD-r perimeter bands (30cm wide, 20cm from wall), ZD-t at doors (15cm offset)
- False ceiling: full fly zone 10cm below ceiling with strain relief flags (Zugentlastung)
- Green (allowed), Red (forbidden), Yellow (dead zone), Blue (preferred paths)
- Three modes: normal, false_ceiling, false_floor
- Cached as
<stem>.wall_zones_<mode>.json
See: 04_wall_zones.md
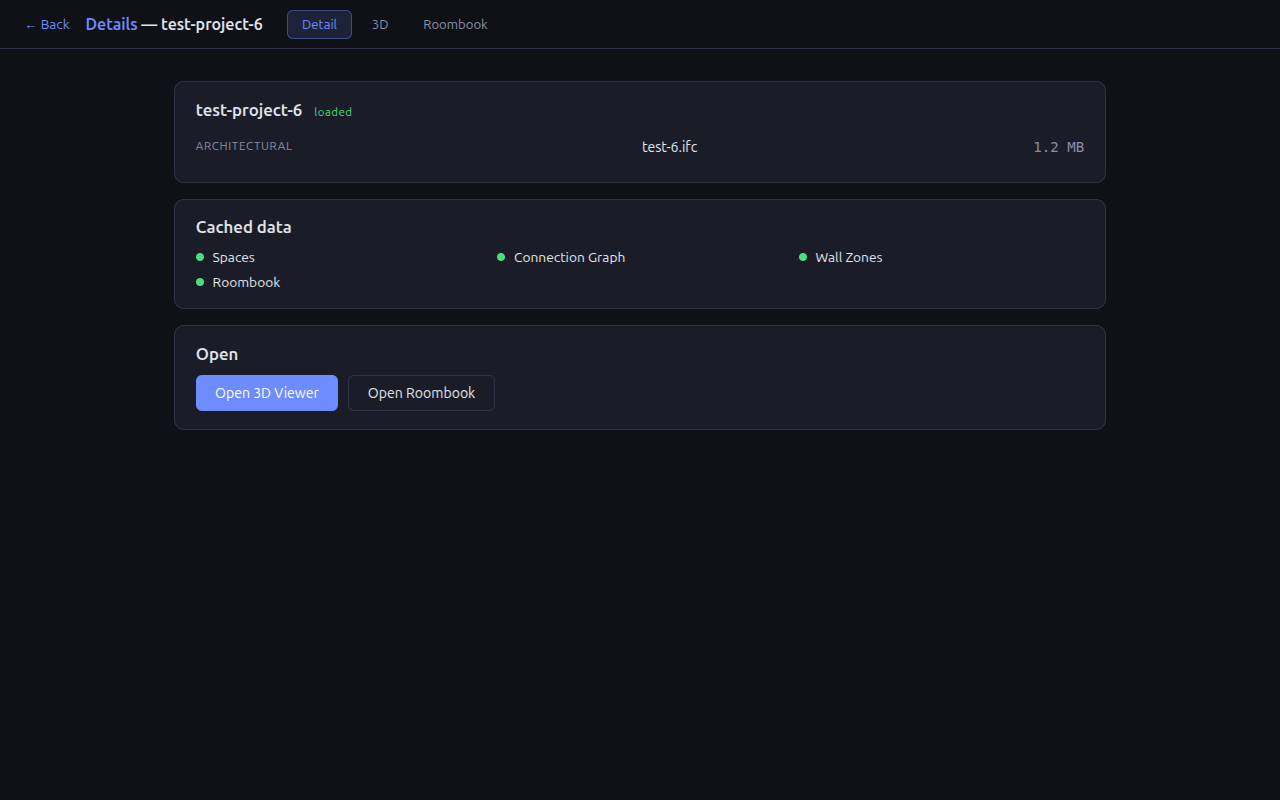
4. Project App Shell + 3D/2D Viewer
Files: templates/viewer.html
- Single-page shell served by
/project-viewer/<project>— Detail / 3D / Roombook tabs with hash routing (#detail,#3d,#roombook). IFC is downloaded once and shared between views; render loop pauses off the 3D tab. - 3D: Three.js + web-ifc with auto-detected coordinate mapping (
ifcToThree()) - Overlays: space containers, connection graph, cable routes, wall zones
- 2D plan view with section plane, wall outlines, darkened slabs
- All backend data in IFC world coords, frontend transforms via
coordMapping = {perm, sgn, off}
See: 05_viewer.md
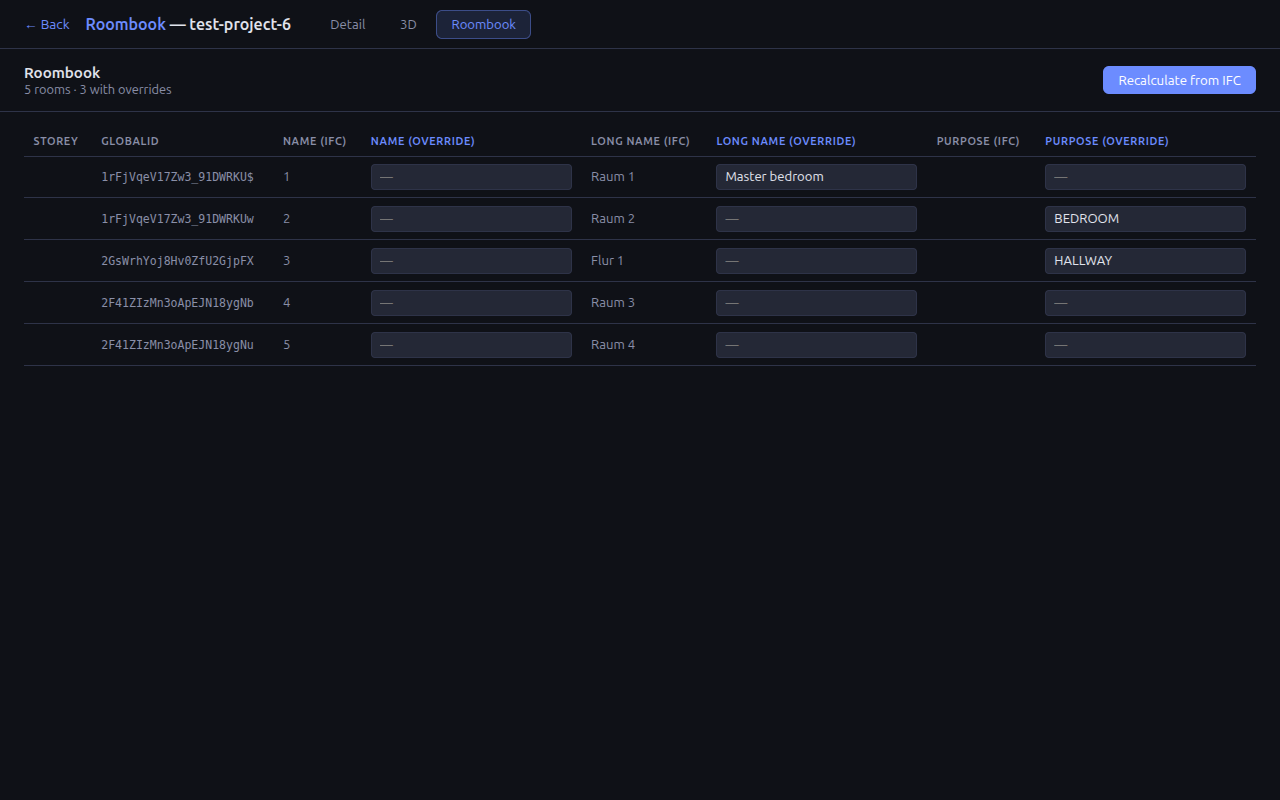
5. Roombook
Files: tools/_roombook.py
- Per-file table of IfcSpace entries keyed by
GlobalId - Paired columns: IFC-extracted value + manual override, for every field
- Persists to
<stem>.roombook.json; recalculating from IFC preserves overrides matched by GlobalId and prunes orphans (returned viadropped_override_ids) - Extensible: add a new field to
ROOM_FIELDS— no schema migration
How They Connect
IFC File
  ├── Connection Graph  → topological nodes + edges for all elements
  │     └── used by MEP Routing (future: replace waypoint graph with connection graph)
  ├── MEP Routing       → light/switch placement + cable paths
  ├── Wall/Ceiling Zones → forbidden/allowed/preferred areas on walls + ceilings
  ├── Roombook          → IfcSpace fields + persistent manual overrides
  └── Project App Shell → Detail / 3D / Roombook views sharing one IFC download
        ├── /project-info endpoint  → file sizes + cache flags in one response (Detail)
        ├── /spaces endpoint        → space containers + coordinate mapping detection
        ├── /connection_graph       → graph overlay
        ├── /analyze (mep_routing)  → route overlay
        ├── /wall_zones             → zone overlay
        └── /roombook endpoints     → roombook table with override persistence
The connection graph provides the topological foundation. Wall zones constrain where cables can go. MEP routing uses both to compute valid paths. The viewer visualizes everything.